
As of 2024, 545 terms, but just 30% (approx.) with definitions!
3′-end
refers to the 3-prime carbon on the deoxyribose or ribose sugar of DNA or RNA, respectively.
5′ cap
“All eukaryotic mRNA contains a cap structure – an N7-methylated guanosine linked to the first nucleotide of the RNA via a reverse 5′ to 5′ triphosphate linkage,” Ramanathan et al. (2016) (link). Important for protein translation initiation, also mRNA protective role.
5′-end
refers to the 5-prime carbon on the deoxyribose or ribose sugar of DNA or RNA, respectively
A-DNA
One of the three possible structures of DNA. Wikipedia entry
References
Richmond, T. J., & Davey, C. A. (2003). The structure of DNA in the nucleosome core. Nature, 423(6936), 145-150.
Accession number
From the glossary of the NCBI Handbook, 2nd edition, quote:
The accession number is a unique identifier assigned to a record in sequence databases such as GenBank. Several NCBI databases use the format [alphabetical prefix][series of digits]. A change in the record in some databases (e.g. GenBank) is tracked by an integer extension of the accession number, an Accession.version identifier. The initial version of a sequence has the extension “.1”. When a change is made to a sequence in a GenBank record, the version extension of the Accession.version identifier is incremented. For the sequence NM_000245.3, “.3” indicates that the record has been updated twice. The accession number for the record as a whole remains unchanged, and will always retrieve the most recent version of the record; the older versions remain available under the original Accession.version identifiers.
Accession numbers are identifiers for entries in data bases. In our business, all sequences entered into the various data bases are given unique identifiers, or accession numbers. For example, the human gene HIF1A has the following accession numbers in the NCBI databases
Examples
ENTREZ gene: 3091
mRNA sequence: NM_001243084
protein sequence: NP_001230013
details from http://www.ncbi.nlm.nih.gov/Sequin/acc.html
The format for GenBank Accession numbers are:
Nucleotide: 1 letter + 5 numerals OR 2 letters + 6 numerals
Protein: 3 letters + 5 numerals
WGS: 4 letters + 2 numerals for WGS assembly version + 6-8 numerals
MGA: 5 letters + 7 numerals
There are a variety of ways to find “accession numbers.” For human genes, Wikipedia is a good starting point, but you’ll want to use databases at NCBI.
At the website you can look up what a particular prefix means. For example, I have a protein sequence with the accession number that begins with “BAD”. I go to Allocation of Accession Prefixes list at http://www.ncbi.nlm.nih.gov/Sequin/acc.html and search for “BAD” under Protein Accession Prefixes and find that “BAD” means the sequence is a DDBJ Protein ID. DDBJ is the acronym for the DNA Database of Japan.
RefSeq accessions include an underscore in the prefix, e.g., NM_001530.4, while INSDC accession prefixes do not. For more about INSDC see https://www.ncbi.nlm.nih.gov/genbank/acc_prefix/ .
Activator
A transcriptional activator is a protein (transcription factor) that increases gene transcription of a gene or set of genes. An example is found in the lac operon, CAP, or the catabolite activator protein, which, when bound to cAMP can bind to DNA sequence upstream of the promoter and operator to enhance binding of RNA polymerase.
Adenine
a nucleobase, a purine.
Image source: chemspider.com
Adenosine
The adenine nucleobase attached to deoxyribose (DNA) or ribose (RNA), with a phosphate group added at the 5′ end of the sugar.
Image source: chemspider.com
Affected relative pair
Two related individuals, both have the same condition or trait. Example, two brothers, both are alcoholics. Clinical and medical genetics.
Alignment
When referring to biological sequences (DNA, Protein, RNA), alignment implies some procedure to match up two or more sequences of the same type by their arrangements of monomers (nucleotides of RNA and DNA, amino acids for protein). Sequence alignments are often an initial step in many bioinformatic work.
Aliquot
A measured volume from the original sample.
Allele
a particular copy (allele) at a specific locus in the genome. First introduced to students in Mendelian genetics, A and a for example, allele applies to any position in the genome, for example, single nucleotide variants (SNV).
Allele frequency
the relative amount in a population of an allele at a specific locus in the genome,
Allozyme
also called alloenzyme. Variants of an enzyme, coded for by different alleles of the same gene (locus).
see also isozyme
Alternative splicing
A regulated process, occurs by rearranging the pattern of intron and exon DNA elements that are joined by splicing to alter the mRNA coding sequence.
Amino acid
organic compound containing a carboxyl (—COOH) and an amino (—NH2) group. The monomers of proteins.
The three letter and one letter codes for the amino acids specified by the genetic code* are
Ala A Alanine
Arg R Arginine
Asn N Asparagine
Asp D Aspartic acid (Aspartate)
Cys C Cysteine
Gln Q Glutamine
Glu E Glutamic acid (Glutamate)
Gly G Glycine
His H Histidine
Ile I Isoleucine
Leu L Leucine
Lys K Lysine
Met M Methionine
Phe F Phenylalanine
Pro P Proline
Ser S Serine
Thr T Threonine
Trp W Tryptophan
Tyr Y Tyrosine
Val V Valine
Asx B Aspartic acid or Asparagine
Glx Z Glutamine or Glutamic acid
source: http://www.ncbi.nlm.nih.gov/Class/MLACourse/Modules/MolBioReview/iupac_aa_abbreviations.html
*Two additional amino acids are
Pyl O Pyrrolysine
Sec U Selenocysteine
Anaphase
stage in mitosis or meiosis cell division in which the chromosomes move away from the midplane to the poles.
Aneuploidy
presence or absence of a typical number of chromosomes in a cell.
Anticipation
from Wikipedia: “anticipation is a phenomenon whereby as a genetic disorder is passed on to the next generation, the symptoms of the genetic disorder become apparent at an earlier age with each generation. Huntington’s disease, fragile X syndrome are examples. In most cases, an increase in the severity of symptoms is also noted. Clinical or medical genetics.
Anticodon
a trinucleotide sequence complementary to a corresponding codon in a messenger RNA (mRNA) sequence, part of the anticodon loop of transfer RNA (tRNA).
Antiparallel
two biopolymers, e.g., DNA strands, which are in parallel, but opposite directions.
Antisense strand
The non-coding strand of a gene sequence. The antisense strand of a DNA molecule serves as the RNA template.
AUG
codon for amino acid Methionine. Typically the start codon, the first codon in a mRNA.
Autosome
Any chromosome that is not a sex chromosome or organelle chromosome (mitochondrial chromosome, chloroplast chromosome).
B-DNA
One of the three possible structures of DNA, the one described by Watson and Crick (based in part of images taken by Franklin and Gosling). The B-form is the predominant structure of DNA in living cells. Wikipedia entry
References
Richmond, T. J., & Davey, C. A. (2003). The structure of DNA in the nucleosome core. Nature, 423(6936), 145-150.
Back mutation
Change in DNA sequence revert (reversion) to original sequence.
Backcrossing
Cross of hybrid offspring with one of the parental lines.
Bacterial artificial chromosome (BAC)
A bacterial artificial chromosome, or BAC, is derived from the F plasmid of E. coli. The F plasmid is large enough to hold larger DNA inserts. BACs are designed so that recombinants can be identified by Lac selection
Baltimore classification
A virus classification system developed by David Baltimore. The classification is based on the type of genome.
From Wikipedia
- I: dsDNA viruses (e.g. Adenoviruses, Herpesviruses, Poxviruses)
- II: ssDNA viruses (+ strand or “sense”) DNA (e.g. Parvoviruses)
- III: dsRNA viruses (e.g. Reoviruses)
- IV: (+)ssRNA viruses (+ strand or sense) RNA (e.g. Picornaviruses, Togaviruses)
- V: (−)ssRNA viruses (− strand or antisense) RNA (e.g. Orthomyxoviruses, Rhabdoviruses)
- VI: ssRNA-RT viruses (+ strand or sense) RNA with DNA intermediate in life-cycle (e.g. Retroviruses)
- VII: dsDNA-RT viruses DNA with RNA intermediate in life-cycle (e.g. Hepadnaviruses)
Bar chart
Bar charts, or bar graphs, are used to compare groups of counts or proportions. For example, the number of SNP by DNA elements for the human gene HIF1A (Figure 1).
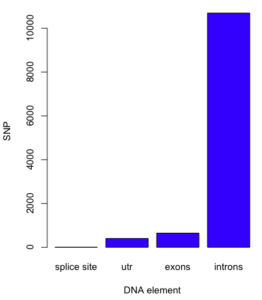
Figure 1. A bar chart with counts.
You will also have seen another use of bar graph, which, as it turns out, is probably done in error. “Bar charts,” where group averages (means) are represented by rectangles with whiskers as a measure of error (standard error, standard deviation, confidence interval), are ubiquitous in research journals. While common, these types of graphs are not a good idea, and in some circles are referred to as “dynamite plots.” There are reasons why you should not use this type of graph, but instead, you should use a box plot, or if there are not too many numbers, a combination of box and dot plots.
We’ll start with the common, but improper bar chart. This type of graph is useful for making “side-by-side” comparisons among a few groups. Typically, you plot the means for several groups and display suitable error bars to show differences, or lack of differences among several groups. Bar charts of more than five groups become difficult to make comparisons, however. Here is an example (Figure 2), of a bar chart for four genes from a qPCR study on a rat lung cell line (L2) with + standard error of the means (SEM). Plot made at plot.ly
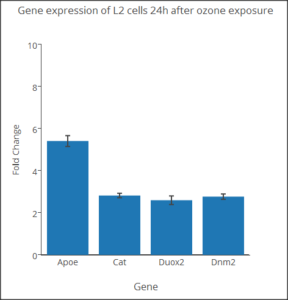
Figure 2. Gene expression rat lung cells.
Microsoft Excel will give you a pretty decent bar chart and, with some coaxing, will produce a graph with proper errors bars.
A nice, but somewhat tricky online site to make graphs is available at https://plot.ly/plot . The graph above was made with that site. You can work as a guest on the site of have to sign up for an account, but among the very nice things about this site is that it can do basic statistics and t-tests for you as well as generate some very nice graphs. The site includes good help, but I have also included a short video guide on How to make a scatterplot or a bar chart with plotly.
Base pair (bp)
short for nucleotide base pair, implies Watson-Crick complementary base pair rules, A-T, C-G
Baseline
Fixed point of reference.
Bayesian
In phylogenetics based on biological sequences for a set of organisms, Bayesian analysis refers to a a statistical approach to data inference (hypothesis testing), in which the researcher holds a model of the evolution for a set of taxa and then the software searches for the set of phylogenetic trees that are consistent with the model and the alignment data.
Bayesian analysis seeks the tree that maximizes the probability given both the model and the data. In Bayesian terminology, this probability is the posterior probability, or our confidence in the model given the fit to the data. The basis for Bayes approach: Given a prior probability and a model of evolution, calculate the posterior probability of the tree. The prior probability can be thought as follows: we know a bunch about evolution (captured by models we choose), we know a bunch about how species are related to each other (fossil evidence, results from other gene trees yield a consensus tree), therefore, it makes sense to incorporate prior knowledge and weigh new data against this understanding. Then, each tree calculated gets a posterior probability associated with it; as the software compares the various trees calculated, then the higher the posterior probability, the greater the likelihood the tree is the correct one.
Bayesian analyses returns a set of best trees, with statistical support for each branch length.
MrBayes (Huelsenbeck and Ronquist 2001), available in UGENE (Okonechnikov et al. 2012), implements Bayesian approach to phylogeny construction.
References
Huelsenbeck, J. P., and F. Ronquist. 2001. MrBayes: Bayesian inference of phylogenetic trees. Bioinformatics 17:754-755.
Okonechnikov K, Golosova O, Fursov M, the UGENE team. Unipro UGENE: a unified bioinformatics toolkit. Bioinformatics 2012 28: 1166-1167. doi:10.1093/bioinformatics/bts091
Blunt end
Refers to DNA, both strands of DNA end in a nucleotide pair, i.e, no unpaired base pairs at ends.
5' --- CCGCATGAAC-3'
3' --- GGCGTACTTG-5'
Compared to sticky end, one strand longer than the other.
Branch length
Branch length refers to the height or length between two nodes in an ordered tree (e.g., a phylogenetic tree). More properly in graph theory, branches are called edges. In the case of gene trees the branch length between an ancestor and its descendent taxa is proportional to the rate of evolution (r, mutation and fixation rate) multiplied by the time (T) since divergence. Branch lengths can be shown to be equal to the average number of substitutions per site of the protein or nucleotide sequence. Between two taxa then the number of expected substitutions can be obtained by the equation
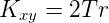
where Kxy is the number of substitutions between taxa x and taxa y.
If working with protein sequences, branch lengths can be converted to number of amino acids substituted by the equation
![]()
C-value
“Characteristic” amount, in picograms, of DNA in haploid cell.
Canalisation
The extent to which a population of organisms exhibit the same phenotype despite changes to environment during development.
Candidate gene
A gene or locus is associated, but not confirmed, with a phenotype (e.g., disease).
Carrier
With respect to genetic-caused recessive condition or disorder, a carrier is heterozygous with respect to the locus. Clinical or medical genetics.
caspid protein
the protein shell of a virus
CCAAT box
A consensus sequence between 60 and 100 bases upstream of transcription initiation site of core promoter sequences of Eukaryote genes. Transcription factor binding site.
cDNA
complementary DNA, double-stranded DNA made using mRNA as template by action of reverse transcriptase to get to the first strand DNA, then by DNA polymerase to make the complementary second strand.
In our qPCR reactions we make “first-strand cDNA,” which means that the reverse transcriptase part and leave the DNA polymerase step to the qPCR reaction.
Cellular reprogramming
Process of reverting mature differentiated cells to pluripotent stem cells.
centimorgan (cM)
Unit of relative distance between loci in a chromosome.
Central dogma
This is a long entry. Coined by F. Crick, first in 1958 and defended and clarified by Crick in 1970, the central Dogma was concerned with how biological sequence information moves between informational molecules in organisms. In the 1958 paper he distinguished between all possible pathways versus the permissible pathways of information flow between DNA, RNA, and protein. Crick concluded that once information was transferred from nucleic acid (DNA or RNA) to protein it could not flow back to nucleic acids — thus, from protein back to RNA or from protein back to DNA, these are the only nonpermissible pathways. Why are these two pathways not permissible? Because there is no inheritance of acquired traits. Changes to proteins during the lifetime of an organism cannot be communicated back to the sequence information in RNA or DNA.
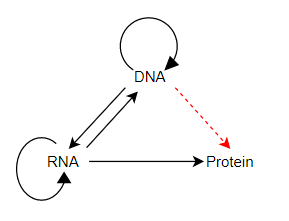
Here’s what Crick wrote in 1958 (p. 153):
This states that once “information” has passed into protein it cannot get out again. In more detail, the transfer of information from nucleic acid to nucleic acid, or from nucleic acid to protein may be possible, but transfer from protein to protein, or from protein to nucleic acid is impossible.
Note that DNA —> Protein is a permissible pathway in the Central Dogma, but as far as we know, no organism bypasses RNA to make protein.
The problem is that since Crick’s introduction of Central Dogma, many textbooks (beginning with J.Watson’s classic 1965 textbook, Molecular Biology of the gene), and research articles have misrepresented the Central dogma as simply “DNA → RNA → Protein”. This problem is not a recent development, where the young are not well-informed of the old concepts. Rather, almost immediately with its introduction, the Central dogma has been misunderstood or misrepresented as the simple statement of “DNA → RNA → Protein”. So much so that Crick wrote a second article Crick 1970), attempting to clarify why it was an important concept. The 1970 article indeed does a better job of clarifying the concept and I recommend that you read it (see link below).
Despite the rather straight-forward presentation of the Central dogma in the 1970 Nature article, writers still get it wrong. For example, both of Klug’s genetics books get it wrong. In Klug et al Concepts of genetics, 11th edition, the glossary entry for Central dogma reads: “The classical concept that genetic information flow progresses from DNA to RNA to proteins.” The exact same, and incorrect, definition appears in the glossary of Klug et al Essentials of genetics. Not all text books get it wrong (see Hartwell et al, Genetics: From genes to genomes, 5th edition, and Krebs et al., Lewin’s Genes, now in it’s 11th edition).
There are a variety of explanations for this misrepresentation — if the phrase “exceptions to the Central Dogma” is used, chances are the Central Dogma is mischaracterized in the work. But simply stated, the “DNA → RNA→ Protein” is just one of the permissible pathways of information flow; it is not Crick’s Central dogma.
Why should you care about this? It is poor science to quote or write about other’s ideas without representing the ideas correctly; it suggests that the author may not have actually read the original work. This is in the essential tradition of science: we recognize and adhere to the practice of scientific priority. Second, some authors have claimed that new discoveries like epigenetics or prions, somehow refute the Central dogma (Koonin 2012). If we take a strict and consistent interpretation of the Central dogma, these very interesting phenomenon do not, indeed, refute the Central dogma.
Note: this entry was inspired by Dr. L. Moran’s Sandwalk blog entries, plus re-reading Crick’s original papers. The complete references and links to these papers, and to others cited in this entry are listed below.
References
Crick, F. H. C. 1958. On protein synthesis. Symp. Soc. Exp. Biol. XII:138-163. [PDF]
Crick, F. 1970. Central Dogma of Molecular Biology. Nature 227:561-563. [PDF]
Koonin, E. V. 2012. Does the central dogma still stand? Biol. Direct. 7:27. [link]
Centromere
a specialized DNA sequence of a chromosome that links a pair of sister chromatids (a dyad). Point centromeres, regional centromeres.
Chimera
An organism with cells with more than one distinct genotypes. Unlike a mosaic, cells in chimera derived from different zygotes.
Chloroplast genetic code
The standard genetic code is used in plant chloroplasts.
Chloroplast genome
The circular chloroplast genome size ranges from 110 to 200 kilobases. Chloroplast DNA contains 60 – 100 genes.
Chromatid
After replication but before division, chromosomes consist of two DNA molecules. A pair of chromatids are called a dyad. After division (anaphase), the chromatids are called chromosomes.
Chromatin
In Eukaryotic cells, refers to combination of DNA and histone proteins, i.e., chromosome packaging.
Chromosomal crossover
exchange of genetic material during Meiosis (Prophase I, process called synapsis), between the non-sister chromatids of homologous chromosome; yields recombinant chromosomes.
Chromosomal duplication
Any copying of a region of DNA that contains a gene
Chromosome
A long DNA molecule which includes part or all of the genetic material of an organism. Eukaryote chromosomes also include histones which bind to DNA and package and condense the DNA into chromatin
Cis-dominant mutation
Mutations that alter the functioning of a gene on same piece of DNA.
Cis-regulatory element (CRE)
Regulatory DNA elements that are binding sites for transcription factors of genes on same piece of DNA
Cis
In genetics, cis-acting refers to CRE, e.g., promoters, enhancers, operators, as opposed to trans-acting regulatory elements
Cistron
Classical definition of a gene as the “functional [genetic] unit” revealed by the cis-trans test (p. 1613 Benzer 1959). Cis-trans test is now called complementation test. Today, the term is used in various contexts to imply a protein-coding gene, i.e., a DNA sequence that codes for a polypeptide, but also any DNA sequence which is transcribed to yield a noncoding RNA product (rRNA, tRNA, etc.).
References
Portin, P., & Wilkins, A. (2017). The evolving definition of the term “gene”. Genetics, 205(4), 1353-1364.
Clade
All the descendent taxa from a common ancestor (represented in a tree by a node), belong to the same monophyletic group. A clade is another term for monophyletic group.
Classical genetics
Refers to the period of research on inheritance – the transmission of characteristics between parents and offspring — prior to the 1930s, including Mendelian genetics, linkage analysis and chromosomal theory.
References
Cloning
Process of producing individual with identical, or nearly so, DNA.
Clustal
A multiple sequence alignment program. Clustal Omega is the current version see description at Wikipedia and links to official website at http://www.clustal.org.
Coactivator
Transcriptional regulatory protein that enhances transcription of another gene sequence
Coding sequence
A CDS is an experimentally confirmed protein-coding DNA sequence. A CCDS is a consensus CDS. Here, consensus is of the type that different parties have reached agreement about a sequence.
Coding strand
Sense strand
Codominance
Both alleles at a genotype are expressed.
Codon usage bias
differences in the frequency of synonymous codons in coding DNA in organisms.
Codon
DNA (or RNA) triplets which code for an amino acid.
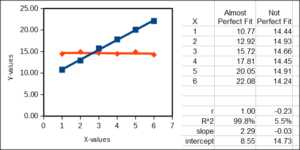
Coefficient of determination
R2, or “R-squared,” is a measure of how well a statistical model (for example a straight line) fits the data. R2 can take on any value between 0 (0%) and 1 (100%). It is the square of the simple product-moment correlation. A value of R2 = 0 means that the model does not fit the data well at all, whereas an R2 of 100% means that the model is a perfect fit to the data. Consider two linear examples, a perfect fit between X and some Y-data (blue) and a less than perfect fit between the same X and some other Y-data (red).
cofactor
Enzymes may need a substance to be present in order to catalyze a reaction
Comparative genomic hybridization (CGH)
technique to detect chromosomal copy number changes.
complementarity
e.g., two genes are interdependent: given an allele at one gene, can only produce a phenotype if a particular allele is present at a second gene.
complementary DNA (cDNA)
DNA synthesized from RNA template (e.g., mRNA, microRNA); reaction catalyzed by reverse transcriptase
complementation test
aka cis-trans test, used to test for complementary genes
Complex trait
aka quantitative traits, any phenotype that differs among individuals by degree not by kind (category). Their inheritance is polygenic (multiple genes), cannot be explained by segregation of alleles at one locus (gene), and expression of the phenotype typically is influenced by environment.
concentration factor
The ratio of the aliquot volume divided by the final volume. It is the inverse of the dilution factor.
Conditional expression
Although every individual in a population has the gene, only a few express the gene. e.g., knockout gene expressed in liver, but not other tissues.
Consensus (canonical) sequence
Sequencing of genes or other DNA elements, all the way to genomes nucleic acids, involves generating sequence reads for fragments (parts) of the whole sequence, then assembling the original sequence from multiple sequence reads of the multiple fragments. Inevitably, separate reads from the sequencer will yield different sequences, even for the same source fragment. Thus, a consensus sequence is simply the result of aligning all sequences for a region (the fragments) and assigning the most common base at each position as the best guess or “consensus” for that position in the sequence. Remember — no technology is without errors and we expect that a sequencer will generate an error or two now and again. For example, if we have six sequence reads for what is supposed to be the same location of a genome:
seq1 -- 5'-ATGGACCG-3'
seq2 -- 5'-ATGGACAG-3'
seq3 -- 5'-ATGGACCG-3'
seq4 -- 5'-ATGGACCG-3'
seq5 -- 5'-ATGGACCG-3'
seq6 -- 5'-ATGGACCG-3'
I’ve highlighted in bold the location in the sequences that differ. If the goal is to report a single sequence, and it generally is if you begin with a single sample, then what is the best guess as to the identity of the base at that position in the sequence? You go with the most common value, which is “C” and thus, the consensus sequence is 5′-ATGGACCG-3′.
What if the original source was a heterozygote? In this case, we would expect half of the sequences to have one consensus read and the other half to have a different consensus read. Consider our five sequences again
seq1 -- 5'-ATGGACAG-3
seq2 -- 5'-ATGGACCG-3''
seq3 -- 5'-ATGGACCG-3'
seq4 -- 5'-ATGGACAG-3'
seq5 -- 5'-ATGGACAG-3'
seq6 -- 5'-ATGGACCG-3'
We see that at position 7, we have both A/C in equal numbers; this would be consistent with assigning the individual as being heterozygous at that locus in the genome.
All sequencing of DNA elements, from genes to genomes, involves collecting multiple sequence reads, and therefore, all sequencing results in publication of a consensus sequence for that DNA element, whether it is a gene or a genome. A criterion for trusting the consensus sequence is how many reads were conducted, the sequence coverage.
Consensus tree
From Wikipedia: “The consensus tree summarizes the nodes that are shared among a set of trees. In a strict consensus, only nodes found in every tree are shown, and the rest are collapsed into an unresolved polytomy. Less conservative methods, such as the majority-rule consensus tree, consider nodes that are supported by a given percentage of trees under consideration (such as at least 50%).”
References
O’Reilly, J. E., & Donoghue, P. C. (2017). The efficacy of consensus tree methods for summarizing phylogenetic relationships from a posterior sample of trees estimated from morphological data. Systematic biology, 67(2), 354-362.
conservation genetics
discipline of genetics which focuses on understanding population genetics to help manage threatened and endangered species.
conserved sequence
refers to identical or highly similar biological sequences (nucleic acids, proteins) among individuals or species over generations.
constitutive expression
gene expression always on, expression at constant, or nearly so, level
contig
A contiguous set of overlapping DNA sequences.
Contrast coding strand
copy-number variation (CNV)
coregulator
corepressor
CRISPR gene editing
crossbreeding
CSV
Comma separated values — the CSV file format is a text only format, readable by any computer as text. The CSV tells the computer that fields (e.g., variables or columns from your spreadsheet file) are separated by commas. When importing this kind of file, the software (e.g., Excel) should interpret the commas accordingly and you then recreate the column format.
Example, three columns, six rows; first row contains header information, columns separated by comma.
Protein, GeneID, Accession number
HIF1A, 3091, NP_001521
SUMO1, 7341, NP_003343
PPP3CA, 5530, NP_001124164
EGLN1, 54583, NP_071334
FOXO4, 4303, NP_005929
Cytogenetics
Refers to genetic studies which focus on behavior of chromosomes during mitosis, meiosis, for example, karyotypes.
Cytosine
a nucleobase, a pyrimidine.
Image source: chemspider.com
Cytidine
The cytosine nucleobase attached to deoxyribose (DNA) or ribose (RNA), with a phosphate group added at the 5′ end of the sugar.
Image source: chemspider.com
degeneracy
deletion (Δ)
deoxyribonucleic acid (DNA)
deoxyribose
Image source: chemspider.com
diluent
The material used to dilute the sample
dilution factor
The ratio between final volume/aliquot volume (final volume = aliquot + diluent)
diploid (2n)
directionality
distance
In a genetics course, distance refers to a measure of genetic distance. We define genetic distance as the amount of divergence between biological sequences (nucleic acids or proteins), where the sequences may be from a collection of genes (proteins), from different individuals within a population, between populations within a species, or among different species or other higher taxa.
There are many statistics to quantify distance, too many to list here. Distance measures are used in the context of an evolutionary model to estimate the evolutionary distance between sequences from the observed differences between the sequences.
UGENE provides access to the following distance methods
- F84 (default)
- Kimura
- Jukes-Cantor
- LogDet
distance measure
divergence
In evolution, divergence may to the amount of differences that have accumulated between groups since they last shared a common ancestor; often, this hypothetical ancestor is called the most recent common ancestor (MRCA).
divergence time
When was the time of speciation between two species? That’s the divergence time, likely in millions of years (mya). We get divergence times (almost!) directly by working with fossils and applying dating techniques (e.g., radioisotope decay). Divergence times can also come from calibrated molecular clocks, provided the assumption of approximately constant evolutionary change holds..
A resource for obtaining divergence times for many organisms is available at Time Tree of Life, http://timetree.org/
DNA condensation
DNA fingerprinting
DNA microarray
DNA polymerase
DNA repair
DNA replication
DNA sequencing
dominance
dosage compensation
double helix
double-stranded DNA (dsDNA)
downregulation
downstream
refers to relative positions within a sequence of DNA or RNA: downstream would refer towards 3′ end of the sequence
Dunning-Kruger effect
A type of cognitive bias, refers to our tendency to believe we know more than we do. In particular, refers to observations that the least informed among us tend to be more certain about their knowledge about subjects.
Kruger, J., & Dunning, D. (1999). Unskilled and unaware of it: how difficulties in recognizing one’s own incompetence lead to inflated self-assessments. Journal of personality and social psychology, 77(6), 1121.
duplication
ecological genetics
electrophoresis
emergenesis
endonuclease
enhancer
envelope protein
a lipid membrane that covers the virus capsid protein
environmental genomics
epigenetics
episome
epistasis
Eukaryote
euploidy
evolution
Evolution means change. Biological evolution is
… change in the properties of populations of organisms that transcends the lifetime of a single individual. Page 7, Evolutionary Biology 2nd ed., by Dr. Douglas Futuyma, one of the leading textbook authors on Evolutionary Biology
Biologists separate evolution as sets of facts (i.e., the overwhelming evidence that life on earth has evolved over time) and theory of evolution (i.e., explanations for how changes in organisms have occurred).
Evolutionary theory, as defined by Futuyma is:
The explanation of how modification occurs and how ancestors gave rise to diverse descendants constitutes the theory of evolution. We now know that Darwin’s hypothesis of natural selection on hereditary variation was correct, but we also know that there are more causes of evolution than Darwin realized, and that natural selection and hereditary variation themselves are more complex than he imagined. A body of ideas about the causes of evolution, including mutation, recombination, gene flow, isolation, random genetic drift, the many forms of natural selection, and other factors, constitute our current theory of evolution or “evolutionary theory.” Like all theories in science, it is a work in progress, for we do not yet know the causes of all of evolution, or all the biological phenomena that evolutionary biology will have to explain. Indeed, some details may turn out to be wrong. But the main tenets of the theory, as far as it goes, are so well supported that most biologists confidently accept evolutionary theory as the foundation of the science of life. page 4, Evolution, 2nd edition
Although evolutionary theory is central to understanding biology, training in evolutionary theory is not well developed in undergraduate curriculum. Moreover, there is a perception held by many that an understanding of current evolutionary theory is not essential to becoming a good physician. This is a dated view and not well justified. For more, read this editorial in 2006 February issue of the journal Science (Neese, Stearns, & Omenn Medicine needs evolution. Science 311:1071).
exome
refers to the part of the genome which contains exons.
exon
exon is short for expressed region, refers to protein-coding elements of a gene. In some cases, you’ll find the term exon also used to describe elements of rRNA and tRNA genes that are present in the mature product after RNA processing.
exon skipping
RNA splicing
exon splicing enhancer
Short sequence motif found at exon/intron borders that control splice site selection.
exonuclease
enzyme that removes successive nucleotides from a sequence
exosome complex
expression vector
expressivity
extrachromosomal DNA
F84
A distance method for estimating branch lengths and phylogenetic relationships based on sequence data, F84 is a four-parameter model in that it incorporates different rates of transition and transversion and also allows for different frequencies of the four nucleotides. Similar to HKY85, the Hasegawa, Kishino and Yano 1985 model. F84 is the default distance method in UGENE.
revised from http://evolution.genetics.washington.edu/phylip/doc/dnadist.html
See Jukes Cantor, Kimura, LogDet
facultative expression
FASTA
The FASTA format (see Wikipedia entry; here is the official NCBI format description) is one of many file formats used to work with nucleic acid and protein sequences.
FASTA format is in plain text file. Acceptable file extensions include *.fa, *.fas; you could also read in files with extension *.txt.
FASTA format has a couple of requirements, which are:
1) First line stats with the “greater-than” symbol “>” (without the quotes) and then text used to describe the file.
Keep description under 80 characters and avoid special characters, especially “, (, |, }, and ‘.
2) Sequences follow IUPAC-IUB amino acid and nucleic acid codes although
lower case letters are OK, i.e., “a” is recognized as “A”
a dash may be inserted to indicate variable length
3) There cannot be any spaces or end-of-line character formatting in the sequence.
Here is an example file
>Sequence 1
CATTCTAACAGTAGTGAGCAGCCCGTAGGCCGCTTCATACCTCTTTGCCTTGTGTGATCTTGCTCTCTCT CCAACTCCATTCTAACATGGTTGAAAATGTGCTTCCTCCATTCTGAGAGGATCTGGGCAGCAGAGTTCAT CTTTGTGTC
See text file
file extension
From Wikipedia: “A filename extension is an identifier specified as a suffix to the name of a computer file. The extension indicates a characteristic of the file contents or its intended use”
List of common file extensions used in bioinformatics
| extension | description | comments about use |
| .aln | ClustalW sequence alignment format | see http://tools.genouest.org/tools/meme/doc/clustalw-format.html for more details |
| .fa | FASTA sequence file format; | comments on first line, starts with the > character. Can have multiple sequences in same file provided each is demarcated by >; See http://tools.genouest.org/tools/meme/doc/fasta-format.html for more details |
| .fasta | FASTA sequence file | see .fa comments |
| .gb | Genbank sequence file | any program that reads GenBank sequence files, e.g., UGENE; contains metadata |
| .gbk | Genbank sequence file | see .gb comments |
| .bam | Binary Alignment Map, compressed version of SAM | see https://wiki.nci.nih.gov/display/TCGA/Binary+Alignment+Map; UGENE works with both SAM and BAM files |
| .sam | Sequence Alignment Map file | see Wikipedia for good description of this file. |
| .nwk | Newick file format | text file that depicts graph (phylogenetic) trees; UGENE and any number of online tree viewer applications can view |
| .pdb | Protein Databank format | text file to represent structure of a protein sequence; see http://www.rcsb.org/pdb/static.do?p=file_formats/pdb/index.html for description of the format |
With the exception of the compressed BAM files, all of the files are text files and can be opened by any software application that can work with sequence files.
fixation
in population genetics, refers to one allele present (or absent) in a population
Fold change
The log2 transform of the ratio of the slopes between a gene and the median gene (F2). The log2 makes ratios symmetrical about 0. A negative value indicates that the slope was less than the median slope; a positive value indicates the slope was greater than median value. You can read more about “fold change” at Wikipedia.
Fold change examples
| Fraction | Ratio | log2 |
| 1/16 | 0.0625 | -4 |
| 1/8 | 0.125 | -3 |
| 1/4 | 0.25 | -2 |
| 1/2 | 0.5 | -1 |
| 1/1 | 1 | 0 |
| 2/1 | 2 | 1 |
| 4/1 | 4 | 2 |
| 8/1 | 8 | 3 |
| 16/1 | 16 | 4 |
frameshift mutation
insertion or deletion of nucleotides interrupts reading frame of a DNR or RNA sequence
function class
index list of Function class elements for SNP database
3 prime utr variant
5 prime utr variant
coding sequence variant
downstream transcript variant
frameshift
genic downstream transcript variant
genic upstream transcript variant
inframe deletion
inframe indel
inframe insertion
initiator codon variant
intron variant
missense variant
non coding transcript variant
splice acceptor variant
splice donor variant
stop gained
stop lost
synonymous variant
terminator codon variant
upstream transcript variant
An example query to obtain numbers of single nucleotide variants (snv) in the introns of gene HIF1A
((HIF1A[Gene Name]) AND “snv”[SNP Class]) AND “intron variant”[Function Class]
gamete
haploid cell, an organism’s sex or reproductive cell.
gel running time
How many volts? How long to run the gel? This is a basic question everyone asks when setting up electrophoresis. In general, the higher the resolution needed, the lower the voltage used. You can get an idea by a simple question. An electrophoresis protocol may suggest a running time with a rate of something like 1.0 V/cm, where V refers to volts and cm refers to the distance between electrodes in centimeters. Note that the distance does not refer to just the length of the electrophoresis gel. The gel miniboxes we use (Thermo EC Classic) have an electrode distance of about 6.5 inches. To calculate the voltage
I would round this up to 20 Volts. Note that this is approximate — what matters is the current (I) and resistance (R) of the gel. For example, I try to keep current to under 300 mAmps. As we all should know, Ohms Law relates current and volts as V = I • R.
GenBank
GenBank is a database of NCBI for sequences of biological molecules. GenBank is not curated and is also a potentially redundant database. GenBank receives original sequences directly from researchers, whereas RefSeq is a curated and nonredundant database. Because sequences for the same DNA element may be submitted by more than one researcher); at RefSeq you’ll find only one sequence for these elements. Tools like Bankit are provided to help researchers submit and check entries for GenBank.
For more about GenBank see Chapter 1 of the NCBI Handbook (link)
gene dosage
Number of copies of a particular gene.
gene drive
gene duplication
Gene Expression Omnibus (GEO)
gene expression
gene mapping
gene pool
gene product
The product resulting from expression of a gene. RNA products of noncoding genes include tRNA, rRNA, and other structural RNA. Proteins are the more traditional viewed products of genes (coding genes).
gene regulation
gene silencing
gene therapy
gene trapping
gene tree
A gene tree, as opposed to a species tree, is a phylogeny of a gene (DNA element). Genes are replicated, passed from parent to offspring. If there are more than one offspring, then a branching point has been generated in the gene tree. Viewing a species tree then, we see that species phylogeny consists of smaller trees (the gene trees).
gene
Basic unit of heredity. The modern definition of a gene consists of discrete heritable sequence of genome that is transcribed and yields a functional product.
genetic association
genetic code
Set of nucleotide sequences read three bases at a time, in RNA form, that are translated to amino acids or instructions for stop (*). There are many genetic codes, they are all highly similar. Humans and other vertebrates use the standard code for nuclear genes and the vertebrate mitochondrial code for mitochondrial gene translation (see The Genetic Codes at NCBI for list of genetic codes). GenBank lists mRNA in DNA sequence form, so I have repeated the tables in DNA (see below).
A codon is defined by the initial nucleotide. For the sequence AUGGGGCAA, if read from the first position (reading frame 1), the codons are AUG + GGG + CAA. Thus, if read from the second position (reading frame 2), the codons are UGG + GGC + a partial codon AA. Finally, the starting at the third position (reading frame 3), we have GGG + GCA.
In addition to coding for amino acids, some codons code for stop translation. In the standard code, these include UAA, UAG, UGA.
See Standard code, Mitochondrial code
genetic counseling
genetic disorder
genetic distance
genetic diversity
genetic drift
genetic drift refers to a process of evolutionary change in population characteristics, but, in contrast to natural selection, change is not associated with specific feature differences among individuals. Change is due to random chance. Populations with few individuals are more affected by genetic drift than are larger populations. Because populations are typically finite in size, it is often challenging to tell whether or not change in population characteristics are due to genetic drift or due to natural selection.
genetic engineering
genetic epidemiology
genetic erosion
genetic genealogy
genetic hitchhiking
genetic marker
genetic recombination
genetic regulatory network (GRN)
genetic testing
genetic variability
genetic variation
genetically modified organism (GMO)
genetics
genome size
genome
genomic DNA (gDNA)
genomic imprinting
genomics
genotoxicity
genotype frequency
genotype
genotyping
germ cell
germ line
Giemsa banding or G-banding.
guanine-cytosine (GC) content
guanine
a nucleobase, a purine.
Image source: chemspider.com
guanosine
The guanine nucleobase attached to deoxyribose (DNA) or ribose (RNA), with a phosphate group added at the 5′ end of the sugar.
Image source: chemspider.com
GWAS
Stands for “Genome Wide Association Study.” A genomics and bioinformatics project that works with sequence data (e.g., SNP) collected on individuals who differ for some phenotype of interest. SNP variation shared by individuals who are identified as having the disease and with (or without) a particular SNP compared to individuals who do not have the disease and without (or with) that same SNP is taken as evidence in favor of the hypothesis that the SNP may cause the condition. Limitations of GWAS studies include that they are observational, not experimental projects, and the identified SNP is correlated with the phenotype difference. As you know, correlation is necessary but not sufficient to identify causation.
hairpin loop
haplodiploidy
haplogroup
haploid (n)
haploinsufficiency
haplotype
HapMap
hemizygous
heredity
heritability
heterochromosome
heterogeneous expression
heterosis
heterozygous
histone
Proteins that pack DNA into nucleosome, main protein component of chromatin. Histones H2A, H2B, H3 and H4 are the core histones, histones H1/H5 are linker histones.
holism
A philosophical position that in order to understand complex systems research programs need to look beyond the view that the whole is the sum of the workings of the parts. Complex systems have emergent properties that cannot be identified by reductionism alone. Holism is not the same as vitalism.
see Reductionism
homologous chromosomes
homologous recombination
Homozygous
Horizontal gene transfer (HGT)
The transfer of genetic information from one species’ genome to the genome of a different species. The modifier “horizontal” is used to differentiate this kind of transfer from the typical vertical transfer of genomes between parents and offspring.
See xenolog
Housekeeping gene
Constitutively regulated genes, products needed for maintenance of cell, expressed in all cells of the organism.
Reference
Eisenberg, E., & Levanon, E. Y. (2013). Human housekeeping genes, revisited. TRENDS in Genetics, 29(10), 569-574.
Human Genome Project (HGP)
hybrid
hybridization probe
hybridization
hypothesis
A proposed explanation for a phenomenon. A scientific hypothesis is potentially testable.
ideogram
In genetics, an ideogram is any representation of a chromosome with regions or loci represented.
idiochromosome
in situ hybridization
inbreeding
incomplete dominance
indel
INSDC
International Nucleotide Sequence Database Collaboration (INSDC), a database of nucleotide sequences from Europe (EMBL), Japan (DDBJ), and the United States (NCBI GenBank).
inducer
inducible gene
ingroup
In a phylogeny, an ingroup is defined as two or more taxa who share a common ancestor. See outgroup in the glossary for more discussion.
inheritance
Biological inheritance is transfer of genetic information, and therefore, traits from parents to offspring via asexual or sexual reproduction.
inosine
A nucleoside found in tRNA
Image source: chemspider.com
insertion
In genetics, insertion mutation refers to addition of a base into a DNA sequence.
insulator
integrase
enzyme produced by retrovirus that helps the virus get its genome integrated into the host’s genome
interphase
Portion of cell cycle prior to division. Includes G1, S, and G2.
introgression
Movement of a gene or DNA sequence from one species to another.
intron
isochromosome
isozyme
enzymes which have the same function but are coded for by different genes (loci).
See allozyme
Jones-Taylor-Thornton
Named after the authors, JTT model (they called it PET91) is a substitution matrix of probabilities of change in amino acid at a site between two aligned, homologous protein sequences. The method is based on counting the frequency of substitutions for each of the 20 amino acids across a series of protein sequences. JTT is similar to the PAM model of Margaret Dayhoff (a pioneer in bioinformatics), but is based on study of more than 2000 protein sequences, whereas the original PAM model was based on the 20 available sequences at the time (1967).
The units are the same: 1 unit is equal to amino acid changes in 1% of all of the sites of the protein. JTT is the default Neighbor Joining methods. To convert from the branch length (e.g., distance = 0.4) between two taxa to the number of amino acid substitutions for a protein of length 500 amino acids, (0.4/100) x 500 = 2 amino acids.
References
Dayhoff, M. O., R. M. Schwartz, and B. C. Orcutt. 1978. A model of evolutionary change in proteins. Pp. 345–352 in M. O. Dayhoff, ed. Atlas of protein sequence and structure. Vol. 5, suppl. 3. National Biomedical Research Foundation, Washington, D.C.
Jones, D. T., Taylor, W. R., & Thornton, J. M. (1992). The rapid generation of mutation data matrices from protein sequences. Bioinformatics, 8(3), 275-282.
Jukes Cantor
As implemented in UGENE, Jukes-Cantor refers to a “one-parameter” distance method for generating the branch lengths. It is the first of the so-called DNA models of evolution and was introduced in 1969. The model assumes that each position in the sequence is free to change independently, like the Kimura approach, and all possible changes are equally likely. Thus, unlike the other methods, the Jukes-Cantor method does not distinguish between rates for transitions and transversions.
revised from http://evolution.genetics.washington.edu/phylip/doc/dnadist.html
See F84, Kimura, LogDet
junctional diversity
V(D)J recombination
junk DNA
This phrase was first used by Tomoko Ohta and she was referring to selfish DNA. Selfish DNA refers to DNA elements like transposons and satellite DNA (e.g., micro-, mini-, and macrosatellites), which have little or no phenotypic effect, but nevertheless increase in the species because of rapid replication of the elements within the host’s genome. Increase in copy number of selfish DNA may occur because of unequal crossing over during recombination or by action of transposition and integration as mobile elements.
The concept of junk DNA is in stark contrast to the idea of functional elements in the genome. Genes, regulatory sequences, NOR, telomere and centromere sequences, these clearly have function, but added together, these DNA elements account for less than 10% of all DNA in the human genome. The rest is made up of pseudogenes, transposons and repetitive satellite sequences — sequences which serve the organism no purpose — hence, junk DNA for short.
Junk DNA is not synonymous with noncoding DNA. Noncoding DNA refers to any DNA element which does not code for polypeptides. Thus, RNA genes are noncoding; all regulatory sequences are noncoding; and all junk DNA elements are noncoding. Noncoding is not synonymous with nonfunctional. In contrast, junk DNA is synonymous with nonfunctional DNA.
Since the publication in 2012 of some of the conclusions from the ENCODE project in which they claimed that 80% of the human genome is functional, the junk DNA term has been under attack. While there is obviously room for legitimate debate on whether any particular DNA element is indeed “junk” (lacking in function), the term is nevertheless a useful description. What the discussion needs to address is, not the straw man argument that junk DNA is ignorance of function, but a statement that a particular DNA element has been shown not to have function. While it is an unworthy-sounding term, we are stuck with “junk DNA” because of the precedence of history and priority of ideas in science.
See Ohta & Kimura (1981) PNAS 78:1129-1132 (pdf)
karyotype
Chromosome count of an organism.
Kimura
Kimura in genetics and evolutionary biology refers to one of the most influential theoretical biologists of the 20th century (Wikipedia entry). In our genetics, genomics, and evolutionary biology courses, Kimura may therefore refer to a number of topics or concepts owing to his accomplishments.
In the context of phylogenetic methods included in UGENE, Kimura refers to a “two-parameter” distance method for generating the branch lengths. The model assumes that each position in the sequence is free to change independently, like the Jukes-Cantor approach, but Kimura model includes different rates for transitions and transversions.
revised from http://evolution.genetics.washington.edu/phylip/doc/dnadist.html
knockdown
knockin
knockout
lagging strand
Law of Dominance
Law of Independent Assortment
Law of Segregation
leading strand
linkage disequilibrium
linkage
locus (loci)
LOD score
logDet
A distance method for estimating branch lengths and phylogenetic relationships based on sequence data, LogDet is a five-parameter model, which basically combines the Kimura and F84 models. Thus, it incorporates different rates of transition and transversion and also allows for different frequencies of the four nucleotides.
revised from http://evolution.genetics.washington.edu/phylip/doc/dnadist.html
See F84, Jukes Cantor, Kimura
logical fallacy
a flaw in reasoning. If a good logical argument is characterized by valid reasoning and well constructed arguments, logical fallacies are those arguments made which are missing or misrepresent key elements necessary to present the argument. Examples of logical fallacies include the straw man argument and red herring arguments.
long arm (q)
lyonization
map unit (m.u.)
mean
A statistical concept; the average value for a collection of observations, x. The mean is one measure of central tendency. The equation for the arithmetic sample mean is
where the X with the “bar” over it is referred to as “X-bar” and symbolizes the mean of the sample, ∑ is sigma and denotes summation operation, n is the sample size, and i refers to each individual observation.
medical genetics
meiosis
Mendelian inheritance
messenger RNA (mRNA)
metagenomics
metaphase
MicroArray and Gene Expression (MAGE)
microchromosome
microRNA (miRNA)
microsatellite
Minimal information about a high-throughput sequencing experiment (MINSEQE)
Minimum information about a microarray experiment (MIAME)
minisatellite
missense mutation
mitochondrial DNA (mtDNA)
mitochondrial genetic code
Vertebrate mitochondrial code
TTT F Phe TCT S Ser TAT Y Tyr TGT C Cys
TTC F Phe TCC S Ser TAC Y Tyr TGC C Cys
TTA L Leu TCA S Ser TAA * Ter TGA W Trp
TTG L Leu TCG S Ser TAG * Ter TGG W Trp
CTT L Leu CCT P Pro CAT H His CGT R Arg
CTC L Leu CCC P Pro CAC H His CGC R Arg
CTA L Leu CCA P Pro CAA Q Gln CGA R Arg
CTG L Leu CCG P Pro CAG Q Gln CGG R Arg
ATT I Ile ACT T Thr AAT N Asn AGT S Ser
ATC I Ile ACC T Thr AAC N Asn AGC S Ser
ATA M Met ACA T Thr AAA K Lys AGA * Ter
ATG M Met ACG T Thr AAG K Lys AGG * Ter
GTT V Val GCT A Ala GAT D Asp GGT G Gly
GTC V Val GCC A Ala GAC D Asp GGC G Gly
GTA V Val GCA A Ala GAA E Glu GGA G Gly
GTG V Val GCG A Ala GAG E Glu GGG G Gly
Alternative start codon(s): ATA and ATT (humans)
source: http://www.ncbi.nlm.nih.gov/Taxonomy/taxonomyhome.html/index.cgi?chapter=cgencodes
mitochondrial genome
mitosis
Part of cell cycle, results in division of duplicated chromosomes of cell and duplicated genetic material, followed by cytokinesis and two distinct cells with copies of ancestral cell genome.
mobile genetic element (MGE)
Genetic elements (sequences) which can move about the genome. MGE include transposons.
mobilome
All MGE in an organism’s genome.
Molecular clock
The molecular clock hypothesis (MCH) is based on the observation that evolutionary changes in protein (and nucleotide) sequences accumulate at a constant rate over time. Given a set of sequences from extant taxa, the number of differences among the sequences are correlated with divergence times among the taxa. The observations that led to the formulation of the molecular clock preceded the development of the Neutral Theory of evolution, a clock-like process would be the outcome of neutral evolution: over time, populations acquire neutral genetic substitutions by random drift.
There are a number of factors that will cause rates of evolution to vary, counter to the expectation of constant rates assumed for the clock. These include differences in
- generation time
- metabolic rate
- efficiency of DNA repair
- population size
- selective pressure
The molecular clock, which is based on the molecular clock hypothesis, is a technique in molecular evolution that uses fossil constraints and rates of molecular change to deduce the time in geologic history when two species or other taxa diverged. It is used to estimate the time of occurrence of events called speciation or radiation. The molecular data used for such calculations is usually nucleotide sequences for DNA or amino acid sequences for proteins.
Calibrated molecular clock is one in which the relative divergence between sequences (e.g., genetic distance) is calibrated against independent evidence of divergence, for example, from the fossil record. For species with fast generation times it may be possible to calibrate against known time since divergence (e.g., descendants from single cell line compared).
In addition to informing the field of molecular evolutionary biology, the molecular clock has been employed to investigate the origins of HIV virus (Neogi et al 2012)
molecular genetics
monophyly
All the descendent taxa from a common ancestor (represented in a tree by a node), belong to the same clade. A monophyletic group is another term for clade.
monosomy
Moore’s law
Named after Gordon Moore, a founder of Intel, the law is certainly not a law like the Bill of Rights or even laws of physics or mathematics. Instead, it is based on observation of the progress in design and capacity of electronic devices. From Wikipedia: Over the history of computing hardware, the number of transistors in a dense integrated circuit has doubled approximately every two years.
mosaicism
Population of cells with different genotypes in an individual organism. Unlike a chimera, cells in mosaic derived from single zygote.
MrBayes
Free bioinformatics software for Bayesian inference of phylogeny. Included software with UGENE. See Wikipedia.
multiple cloning site (MCS)
MUSCLE
MUltiple Sequence Comparison by Log-Expectation (MUSCLE) is computer software for multiple sequence alignment of protein and nucleotide sequences. MUSCLE is used to replace CLUSTALX because it is thought to result in better alignments. See the official website at http://www.drive5.com/muscle/
mutagen
Any agent, natural or otherwise, that causes mutation.
mutation
Change in DNA sequence. Mutations may or may not result in altered phenotypes.
natural selection
The differential survival and reproduction of individual organisms in a population because of differences of phenotype. Evolutionary response to selection requires three things be present (from Lewontin 1970):
- Different individuals in a population have different morphologies, physiologies, and behaviors (phenotypic variation).
- Different phenotypes have different rates of survival and reproduction in different environments (differential fitness).
- There is a correlation between parents and offspring in the contribution of each to future generations (fitness is heritable).
Additionally, the presumption is that more individuals are born than can survive and reproduce (the environment limits populations).
If these conditions are present, then populations will evolve as a response to natural selection. Over time (generations), the characteristics of the population will change.
Types of natural selection
Directional selection – increase of an extreme form over other variants in a population. If a trait is under this kind of selection, over time, the mean increases, but variance decreases. Population genetic variation decreases.
Disruptive (diversifying) selection – decrease of intermediate forms in favor of both extreme forms in a population. If a trait is under this kind of selection, over time, the mean stays the same, but variance increases. Population genetic variation increases.
Negative (purifying) selection – elimination of deleterious (harmful) mutations in a population. If a trait is under this kind of selection, over time, both the mean and the variance decrease. Population genetic variation decreases.
Positive (Darwinian) selection – increase of advantageous (beneficial) mutations is a population.
Stabilizing selection – increase of intermediate forms over either extreme variants in a population. If a trait is under this kind of selection, over time, variance decreases, while the mean remains the same. Population genetic variation decreases.
Both negative and positive selection are forms of directional selection. Note that selection on alleles is independent on the dominance or recessive status of the allele.
Units of selection
What is the object of natural selection? We typically think at the level of individual organisms, and indeed, selection acts on individual differences if these are in turn heritable and associated with differences in survival and or reproduction. Clearly, individuals in a population meet the three principles above; the principles are general however. At any level of biological organization, evolutionary change will occur as a result of selection if there is variation, heritability, and differential survival and or reproduction. Selection may therefore act at the level of individuals, but also within individuals (e.g., differential intragenomic survival and reproduction of DNA elements) and above at the level of groups (e.g., different populations, or even among species).
Fixation probability of a favorable mutation
With a number of simplifying assumptions, the fixation rate of a new, beneficial mutation in a population can be given by
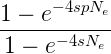
where e is the base of the natural logarithm, s is the selective advantage of the beneficial allele, p is the initial frequency of the beneficial allele, and Ne is the effective population size. If the population size is effectively very large, then the probability of fixation is given by

and finally, if effective population size is the same as the census population size N, then we have the fixation probability of a beneficial allele at a probability of 2s (Patwa and Wahl 2008). In English, the fixation probability of a new mutation that is initially present only as a single copy in the population will copy decrease in a large population, but for an allele that is present at a given frequency the fixation probability will increase with population size
References
Lewontin R C 1970 The units of selection. Annual Review of Ecology and Systematics 1:1-18. (link)
Patwa Z, Wahl LM (2008) The fixation probability of beneficial mutations. J R Soc Interface 5(28): 1279–1289. (link)
neighbor joining (NJ)
Neighbor Joining (NJ) is a statistical tool for clustering (grouping) objects for which distances have been obtained. The distances between each pair of objects (e.g., taxa) are arranged in a matrix. The NJ algorithm them joins groups of objects by the distances between them, linking groups of objects with short distances and distributing other such groups that have greater distances between them. The algorithm does this repeatedly, joining all of the groups until a statistical criterion is reached. This criterion is a “minimum evolution” requirement, which means that the resulting tree has branch lengths as short as they can be. Among all of the approaches to tree-building, NJ is a very fast method and it has the property that if the distance matrix is correct (i.e., accurately reflects the true evolutionary story among the taxa included), the the NJ method will return a tree that accurately reflects that story. In other words, the branching patterns will be correct. NJ was introduced in 1987 (Saito and Nei, 1987, Mol. Biol. Evol. 4(4):406-425), and remains a useful tool to this day, although distance methods themselves have been replaced by other techniques.
neutral mutation
Any DNA change resulting in neither beneficial nor harmful alteration of phenotype. Includes synonymous mutations (e.g., Genetic code redundancy), substitutions of chemically similar amino acids, or changes to non-functional regions of genome.
neutral theory
Most mutations in protein and nucleotide sequences occur by small mutations which occur by chance: point mutations and small deletions or insertions. When a new allele appears in the population, it’s fate will be either it disappears from the population or increases in frequency. The frequency of new mutation in the population depends on random genetic drift and/or positive selection. Most of these mutations will be neutral with respect to the phenotype. No change in protein function. This is the essence of the neutral theory of evolution. Of the mutations that do affect the function of a protein, most will be deleterious, and in principle, will be eliminated from the population by natural selection. Conversely, the rare beneficial mutation is expected over time to increase in frequency in the population, again due to natural selection. For neutral mutations, frequency of the mutation in the population will be subject to random genetic drift.
Moto Kimura worked on many aspects of Neutral theory of evolution. Some of the principle outcomes are quite important in understanding population genetics. For one, consider the fate of a new allele (mutation) in a diploid population of size N. What is the probability that this new allele will go to fixation in the population, i.e., increase to 100%? Let μ (“mu”) be the mutation rate; the initial frequency of a new mutation in the population then would simply be 1/(2N). The number of new mutations per generation is 2Nμ. Thus, the probability of fixation can be calculated as the of new neutral mutation rate multiplied by its initial frequency in the population, the probability of fixation is
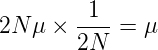
Thus, for a neutral allele, the rate of fixation is just μ, the rate that these mutations occur in the population.
NEWICK
Newick is a format for representing phylogenetic trees. Newick is the format used in UGENE. Newick files typically have the extension .nwk, but they are just text files and can be read by any text viewer application.
In brief, brackets and commas are used to identify nodes and groupings. Branch lengths may also be included by adding a colon “:” after the OTU name. At the end of the command, a semi colon is used to mark the end of the format entry.
Some examples, four OTUs: A, B, C, and D
Newick example 1: ((A,B),(C,D));
| Rooted tree (mid-root) | Unrooted tree |
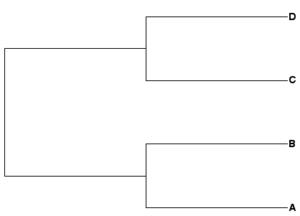 |
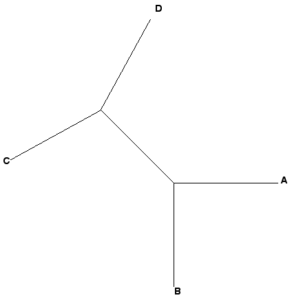 |
Newick example 2: ((A,B),C,D);
| Rooted tree, D outgroup | Unrooted tree |
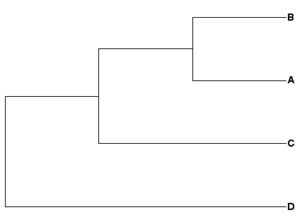 |
 |
see Wikipedia link for more about the Newick format
Other tree file formats
NEXUS
Phylip
NEXUS
see Wikipedia entry
Other tree file formats
NEWICK
Phylip
nitrogenous base
non-coding DNA
Noncoding DNA refers to any DNA element that does not code for polypeptides. Thus, RNA genes are noncoding; all regulatory sequences are noncoding; and all junk DNA elements are noncoding. Transposons are noncoding even if they contain open reading frames, because these ORFS do not code for functional products for the organism (the host) — rather, these ORFs code for products for the transposons themselves (the parasites, the selfish DNA). Noncoding is not synonymous with nonfunctional. In contrast, junk DNA is synonymous with nonfunctional DNA.
non-coding RNA
non-homologous end joining (NHEJ)
noncoding strand
Noncoding strand
nondisjunction
nonhomologous recombination
nonsense mutation
Northern blotting
nuclear genome
nuclear membrane
nucleic acid sequence
Nucleic acid
Biological polymers of sequences of nucleotides (monomers).
Nucleobase (nitrogenous base)
Nitrogen containing molecules which form monomers of nucleic acids. Canonical DNA or RNA bases are adenine and guanine (purines) and cytosine, thymine, and uracil (pyrimidine). Pairing between purine and pyrimidine bases, as opposed to pairing between purine and purine or pyrimidine and pyrimidine bases ensures constant width between the two DNA strands. Components of nucleosides (add 5 carbon sugar) and nucleotides (add phosphate group to nucleoside). Modified bases include
Nucleolus
Located in the nucleus of eukaryote cells, the site of structural ribosome synthesis.
Nucleoside
Consists of a purine or pyrimidine nucleobase plus a pentose (five) carbon sugar, ribose or deoxyribose.
Nucleosome
The basic structural unit of packaged Eukaryote DNA (chromatin). Includes two turns of DNA wrapped by histone octamer: two copies each of histone 2A, 2B, 3H and 4H linked to histone HA.
Nucleotide
the monomers of nucleic acids. Consist of a nucleoside linked to a pentose sugar and a phosphate group.
Nucleus
Membrane bound Eukaryote organelle which contains the chromosomes. Site of RNA transcription.
Null allele
a mutation that removes production of a protein.
nullizygous
an organism carries two null alleles at a gene.
Okazaki fragments
Associated with synthesis of the lagging DNA strand in replication, these fragments begin with a short RNA primer sequence followed by a stretch of DNA complementary to template strand. Dna2 endonuclease removes RNA primer, Flap endonuclease I removes overhang at 5′ end, and DNA polymerase synthesizes new DNA. DNA ligase removes gaps.
Oligonucleotide (oligo)
refers to short DNA or RNA nucleotide sequences. Lengths reporters as -mers. For example, a DNA sequence of ten nucleotides is a decamer. More generally, oligo refers to a number of repeating units or monomers.
Oncogene
A gene that has the potential to cause cancer. See proto-oncogene.
Open reading frame (ORF)
An Open Reading Frame, or ORF, is a DNA sequence believed — i.e., has potential — to be protein-coding. It is identified by start and stop codons and continuous sequence sufficiently long to code for a viable protein. It’s an open sequence because it is not interrupted by a stop sequence. An ORF is a putative CDS. Thus, by definition, protein-coding cistrons are ORFs.
Operon
Group of open reading frames that share a single promoter/operator regulatory sequence. Classic example is the lac operon.
Origin of replication
orphan gene
ortholog
Two homologous (homology) genes (DNA elements) are orthologous if they are derived from a speciation event, i.e., the two genes originated from a single ancestral gene in the last common ancestor.

References
Koonin EV (2005) Orthologs, Paralogs, and Evolutionary Genomics. Annu. Rev. Genet. 39:309–338 (link to pdf file)
OTU
OTU stands for operational taxonomic unit. It can refer to any level of sampling for a phylogeny experiment, from individuals to populations, species and higher taxonomic units. OTU is used when working in phylogenetics and the taxonomic designation may not be consistent with the evolutionary relatedness of the samples. There are slightly different definitions depending on the context of a phylogenetic exercise.
See Wikipedia entry.
outbreeding
outcrossing
outgroup
A taxon outside the group (clade) of interest. Members of the clade are more closely related to each other then they are to the outgroup. For example, any of the three Marsupials (orange block in Fig. 1), while they are a clade of mammals, are appropriate choices for the outgroup of Eutherian mammals (the ingroup). Thus, ingroups are defined as two or more taxa who share a common ancestor.

Figure 1. Representative phylogeny of three Marsupials (orange block) and six Eutherian mammal species. The horizontal axis is time in millions of years since the last common ancestor. Tree from timetree.org.
Adding an outgroup to a phylogenetic tree allows you to “root” the tree, providing the direction of change, because outgroups diverged before the ancestors of the ingroup diverged. Note that you cannot assign a taxon to an outgroup based on the character under study. In other words, after constructing a gene tree for HIF1A, I cannot go back and identify an outgroup for my comparisons based on the results for HIF1A. Like any hypothesis, outgroups are specified before the start of the study.
overexpression
p53
palindromic sequence
PAM
Point Accepted Mutation (PAM): Probability of replacement of one amino acid for another in between a pair of aligned protein sequences. Collected from available protein sequences, arranged in a 20X20 matrix, where each row represents one of the standard amino acids. For each pair of proteins, derive counts of how many times one amino acid is substituted for another. PAM matrices were first presented by Margaret Dayhoff in 1967. The original PAM matrices were based on 20 protein sequences; by 1978 this had increased to 1572 observed mutations in the phylogenetic trees of 71 families of closely related proteins (Wikipedia). Used in the Jones-Taylor-Thornton algorithm for calculating distances
paralog
Two homologous (homology) genes (DNA elements) are paralogous if they are derived from a gene duplication event.

References
Koonin EV (2005) Orthologs, Paralogs, and Evolutionary Genomics. Annu. Rev. Genet. 39:309–338 (link to pdf file)
parsimony
Adapted from Wikipedia:
Occam’s razor, or the law of parsimony is a problem-solving principle that, put simply, states that “simpler solutions are more likely to be correct than complex ones.” When presented with competing hypotheses to solve a problem, one should select the solution with the fewest assumptions.
We may use parsimony principles in making phylogenetic trees. When considering how to group taxa in a phylogeny, and given the possibility that practically infinite number of changes that may have occurred, we favor solutions that minimize the total number of changes.
particulate inheritance
pedigree chart
penetrance
peptide
pharmacogenomics
phenotype
phosphate backbone
phosphodiester bond
PHYLIP
Phylip (or PHYLIP) stands for PHYLogeny Inference Package and consists of 35 programs for use with constructing phylogenetic trees. UGENE and MEGA both include routines from PHYLIP. See Wikipedia for more information.
Also may refer to the tree format
phylogenetic tree
phylogenetics
PhyML
Phylogenetic Analysis using Maximum Likelihood analysis of protein and DNA sequences
Maximum likelihood is a statistical method to estimate the parameters of a statistical model, given the set of observations. Given the amino acid differences among aligned sequences (i.e., the set of observations), what model maximizes the likelihood of the data? PhyML gives the approximate probability that a particular branch exists in the true phylogenetic tree. Uses sophisticated models that specify substitution (e.g., LG), gamma distribution (“normal”)
References
Guindon, S., Delsuc, F., Dufayard, J. F., & Gascuel, O. (2009). Estimating maximum likelihood phylogenies with PhyML. In Bioinformatics for DNA sequence analysis (pp. 113-137). Humana Press. (Link to manuscript, pdf)
Guindon, S., Dufayard, J. F., Lefort, V., Anisimova, M., Hordijk, W., & Gascuel, O. (2010). New algorithms and methods to estimate maximum-likelihood phylogenies: assessing the performance of PhyML 3.0. Systematic biology, 59(3), 307-321. (link to website)
plasmid
pleiotropy
ploidy
Plural nuclei
point mutation
poly(A) tail
polyadenylation
polygene
polygenic trait
polylinker
polymerase chain reaction (PCR)
polymorphism
polypeptide
polyploid
polysome
polytomy
Polytomy refers to a section of a gene tree or a phylogeny in which the relationships cannot be fully resolved to dichotomies (tree bifurcates to two taxa). Polytomies may arise for two reasons: insufficient evidence to support splitting the taxa into a set of dichotomous branches or speciation. A soft polytomy is of this kind: in truth, the species diverged at different times, but we don’t have enough information to support the branching. On the other hand, a hard polytomy is one in which three (or more!) taxa diverged more or less simultaneously (in geologic time)m from a single common ancestor.
population
A population in biology refers to all of the individuals of a species in a given geographical area. If every individual in the population is counted, this would constitute the population census, N. In population genetics one recognizes that the breeding population size is not necessarily the same as the census number. One formulation of the effective population size, Ne, is given by

population genetics
positional cloning
post-transcriptional modification
post-translational modification
primary transcript
primer
a strand of nucleotide sequences that is use to start (“prime”) DNA synthesis. Primers are necessary because DNA polymerases add nucleotides only to an existing DNA molecule and require an available 3-prime hydroxyl group.
proband
probe-set
probe
prometaphase
promoter
prophase
prosposita
prosposito
protein
proteinase
or protease, catalyzes the break down (catabolism) of proteins by breaking the polypeptide bonds (hydrolysis). Also called a protease. There are six classes of proteases based on the target amino acid that is cleaved by the enzyme
Aspartate protease
Cysteine protease
Glutamic acid protease
Metalloprotease
Serine protease
Threonine protease
proteome
pseudogene
There are two kinds of pseudogenes. They are examples of evolutionary relics, analogous to vestigial organs like our appendix in which ancestral function has been lost.
The classical or conventional pseudogene is a DNA element that once was a gene, but is now inactive because of the accumulation of mutations (i.e., result of evolutionary process that occurs over many generations). Think of evolutionary decay.
But there are other pseudogenes. Processed pseudogenes result from integration into the genome of a reverse-transcribed copy of an mRNA (cDNA).
By definition, pseudogenes are types of junk DNA. Note that this does not mean that pseudogenes are not transcribed (some lncRNA come from transcribed pseudogenes), nor does it mean that mutations in pseduogenes cannot harm the organism e.g., some cancers associated with mutations in pseduogenes). It does mean that the product of a pseduogene, if any, serves no benefit to the organism.
Pseudouridine
5-ribosyluracil, greek symbol Ψ, common post-transcriptional RNA modification found in rRNA, snRNA, and tRNA, now famously added to mRNA vaccines (2023 Nobel Prize in Physiology or Medicine).
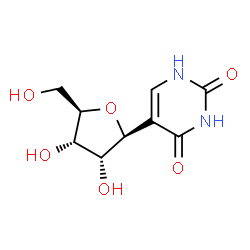
Image from Chemspider.com
Punnett square
Inheritance of dominant mutant allele for huntingtin gene (HTT)
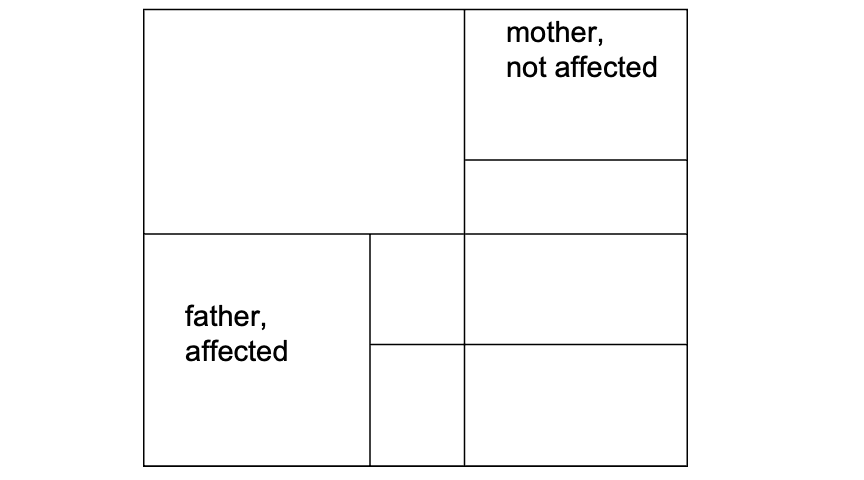
50% affected.
Puttett’s square is a simple tabular accounting of possible offspring genotypes from Mendelian crosses, named for R. C. Punnett. See Edwards, A. W. F. (2012). Reginald Crundall Punnett: First Arthur Balfour Professor of Genetics, Cambridge, 1912. Genetics, 192(1), 3-13.
purebred
purine
putative gene
pyrimidine dimer
pyrimidine
quantitative genetics
Quantitative genetics is an extension of population genetics to the study of the inheritance of traits that show a continuous distribution of phenotypes in a population. Where population genetics focuses on the Mendelian inheritance of one or at most a few genes or loci, quantitative genetics is concerned with applications of Mendelian principles to traits affected by multiple genes or loci. Two key concepts are heritability, h2, defines as the proportion of total phenotypic variance attributable to genetic variance, and the genetic correlation, rg, defined as the proportion of the phenotypic correlation between two traits attributable to shared genetic effects.
quantitative PCR (qPCR)
quantitative trait locus (QTL)
quantitative trait
read
Nucleic acid sequences are obtained from each fragment of the larger DNA or RNA molecule. Each nucleotide sequences is called a read. The reads are used later to reconstruct the original sequence by creating a consensus sequence. A criterion for trusting the consensus sequence is how many reads were conducted, the sequence coverage.
reading frame
real-time PCR (rtPCR)
recessiveness
recombinant DNA (rDNA)
red herring
Red herrings are arguments or points raised in a debate which, intentionally or otherwise, distract or mislead the reader from the main argument or point of discussion.
From Wikipedia:
As an informal fallacy, the red herring falls into a broad class of relevance fallacies. Unlike the straw man, which is premised on a distortion of the other party’s position, the red herring is a seemingly plausible, though ultimately irrelevant, diversionary tactic. The expression is mainly used to assert that an argument is not relevant to the issue being discussed.
reductionism
Reductionism is an approach and philosophy about how one studies phenomena in biology. It is the view that the various scientific domains in biology, from the properties of an individual organism to populations, species and even life itself all can be explained by the actions of agents at lower levels. At its extreme, reductionism would hold that ultimately all biology can be explained by molecules and their interactions. Many philosophers of science hold that reductionism is of three kinds
ontological reductionism – each system (e.g., an organism, a population of organisms, an ecosystem) can be explained if we know all of the molecules and their interactions. In other words all problems in biology reduce to the level of molecules, bonds, and reactions; the sum of the parts adds up to the whole. This is a materialistic view. For example, respiration can be explained ultimately as a process involving exchange of oxygen and carbon dioxide.
methodological reductionism – problems in biological research are best studied by looking at the lower levels. In other words, this view holds that one cannot hope to gain insight into how a process works unless the experiment includes manipulations of causes at the levels of molecules and their interactions. Identify the parts of the system and this will help you understand how the organism functions. This view is controversial and, unlike the ontological position, is probably not a generally held belief about how one should in fact do biological research.
epistemic reductionism – knowledge at a higher domain of scientific inquiry (e.g., Mendelian transmision genetics) can be completely explained by knowledge at a lower domain of inquiry (i.e., molecular genetics).
These categories are in common to all science. In biology, an additional and key distinguishing feature is that of the impact of history on organisms. All organisms are descendents of other organisms, going back through time. Thus, in biological research as opposed to physics, outcomes in biology are viewed as probabilistic (historically contingent) and less deterministic (governed by laws). This distinction is best described by identifying biological research programs that seek to identify cause of any particular biological event as belonging to one of two approaches: how something works (proximate cause) and why something works the way it does, as opposed to some other way (ultimate cause). How DNA works to serve as the key storage molecule of biological information can be explained by how nucleotide bases hydrogen-bond with their complementary base, how DNA replication systematically copies that information, and how meiosis projects the organism’s information to the next generation. Why DNA works as the storage molecule can be explained by an evolutionary argument — our ancestors survived and left their information to subsequent generations because DNA served the purpose better than other storage molecules.
Arguably most scientists hold to the ontological reductionism view. Where disagreements and different research programs disinguish themselves philosophically is over whether methodological and or epistemological reductionism are in fact the best course for studying and interpreting biological problems. The alternatives are holism and vitalism. Vitalism is the view that life is funamentally different from non-life, ruled by laws that are fundamentally different from those that govern non-living things, and as such, cannot be explained by materialistic approaches alone (Kirschner et al, Cell, 2000, 100:79-88). There are few, if any research programs in biology that would be characterized by a vitalism philosophy, but vitalism remains an important perspective in medicine. Ultimately then, a vitalistic approach would posit that are knowledge of a system will always remain incomplete. Unlike vitalism, holism is the materialistic view that understanding how all of the parts work and all of their interactions ultimately will not be enough to explain the workings of the whole. In other words, organisms exhibit emergent properties (Pigliucci, Biol. J. Linnean Soc., 2014 112:261-267), features that cannot be explained solely by the actions of molecules. Systems biology (Gatherer BMC Systems Biology 2010, 4:22), and before that, ecology and integrative biology (e.g., Pianka and Sweet, BioEssays 2005 27:647–652), describe research programs that seeks to identify emergent properties. For an example, is the best explanation for why a dolphin society exists, as described by the numbers and kinds of interactions between its members, even after catastrophic losses of most of the individuals of the society, because of the actions of molecules or is the organization an emergent property and thus more than the sum of its parts? (cf. Lusseau Proc. Royal Soc. Lond B Suppl., 2003, 270:S186–S188).
References and suggested further reading
Brigandt, Ingo and Love, Alan, “Reductionism in Biology”, The Stanford Encyclopedia of Philosophy (Winter 2014 Edition), Edward N. Zalta (ed.)
Wikipedia Philosophy of Biology.
Additional references are cited in text
reference sequence
A reference sequence? It is the consensus sequence, i.e., from multiple reads, assigned to represent the DNA element, gene, or genome sequence for the species. The concept of the reference sequence is is directly comparable to the type specimen concept in a museum collection (see Wikipedia entry if you don’t know what I mean by a type specimen). The NCBI database RefSeq hosts records of reference sequences for more than 16,000 organisms. At RefSeq you’d be able to search and find reference sequences for the DNA sequence of a gene, the mRNA and protein sequences (may be several if there is alternative splicing for the gene). Unlike GenBank where multiple sequences may be present for the same DNA element (e.g., because submitted by more than one researcher), at RefSeq you’ll find only one sequence for these elements. GenBank receives original sequences directly from researchers, whereas RefSeq is a curated and nonredundant database.
For more about RefSeq see Chapter 18 of the NCBI Handbook (link)
refseq
A reference sequence.
From The NCBI Handbook, 2nd edition, quote:
RefSeq, NCBI‘s Reference Sequence project, is a non-redundant, annotated set of sequences that serve as reference standards. They are derived from the INSDC databases and include chromosomes, complete genomes (plasmids, organelles, viruses, archaea, bacteria, and eukaryotes), intermediate assembled genomic contigs, curated genomic regions, mRNAs, RNAs, and proteins.
Definitions, from https://www.ncbi.nlm.nih.gov/refseq/about/, quote:
- Model RefSeq: RNA and protein products that are generated by the eukaryotic genome annotation pipeline. These records use accession prefixes XM_, XR_, and XP_.
- Known RefSeq: RNA and protein products that are mainly derived from GenBank cDNA and EST data and are supported by the RefSeq eukaryotic curation group. These records use accession prefixes NM_, NR_, and NP_.
replication
replicon
reporter
repressor
residue
response element
restriction enzyme
restriction fragment length polymorphism (RFLP)
restriction fragment
restriction site
reverse transcriptase
ribonuclease
ribonucleic acid (RNA)
ribose
ribosomal RNA (rRNA)
ribosome
RNA interference
RNA polymerase
RNA splicing
RNase H
a class of enzymes that break down RNA
rooted tree
“The root of a [phylogenetic] tree or clade represents its first and deepest split, and it therefore provides the arrow of time for polarizing the historical sequence of all subsequent evolutionary events.” Graham et al. (2002).
In graph (tree) theory, a rooted tree is one in which one of the (OTUs) tips has been selected to be the root of the tree; this rooting provides orientation to the tree such that the other tips branch near or further away from the root. An unrooted tree in contrast can show relationships but cannot be used to assign direction of change. In a rooted phylogeny, the root would be interpreted as ancestral to the rest of the tree. Adding a root to a tree permits one to assign direction of change in character state and to infer ancestral states. A tree may be rooted at the midpoint or “center of mass” of the edges or branches (middle of longest path), or the tree may be rooted by the identification of an outgroup relative to the ingroups.
| Midpoint rooting | Outgroup rooting |
 |
 |
References
Graham, S. W., Olmstead, R. G., & Barrett, S. C. (2002). Rooting phylogenetic trees with distant outgroups: a case study from the commelinoid monocots. Molecular biology and evolution, 19(10), 1769-1781.
rs SNP
The “rs” is an accession number and stands for “reference SNP.” For example, rs1957757 is an C/T SNP of an intron in the gene HIF1A. This SNP is associated with elevated blood pressure.
Sanger sequencing
scaffolding
scatter plot
A scatterplot or scatter plot is an “X-Y” plot and is used to show association between two ratio scale variables.
An example is shown below.

The horizontal or “X-axis” shows one ratio-scale variable (Median divergence between two OTU in MYA or millions of years ago) and the vertical or “Y-axis” shows the other ratio-scale data (Protein distance data from the Jukes-Cantor algorithm in PHYLIP.) The straight line is the linear trend line from a regression through the origin (Y = a + b·X, with Y-intercept a = 0).
Microsoft Excel will make a good scatter plot and you can fit a trend line through the origin as well. The graph above was made from the plot.ly website. The site has good online help and for your convenience I have posted a short video as well How to make a scatterplot or a bar chart with plot.ly.
selective sweep
sense strand
Sense strand
sequence alignment
Bioinformatics concept involving arranging sequences of nucleic acids (DNA, RNA) or proteins to identify regions of similarity between two (pairwise) or more (multiple). The interpretation is that two sequences that share sequences in common have these similarities because they shared a common ancestor (in the case of comparing sequences between two taxa) or are members of the same gene family (hence, shared sequence because of past duplication event). Wikipedia has a pretty good discussion about sequence alignment.
sequence assembly
sequence assembly refers to bioinformatic routines that help to align and merge fragments from a longer DNA sequence into contigs in order to reconstruct the original sequence
sequence motif
sequence-tagged site (STS)
sex chromosome
sex linkage
short arm (p)
short tandem repeat (STR)
short tandem repeat
shotgun sequencing
silencer
silent mutation
simple sequence repeat (SSR)
single nucleotide polymorphism (SNP)
single-stranded DNA (ssDNA)
sister chromatids
small interfering RNA (siRNA)
SNP
single nucleotide polymorphism
SNP class
Index list of SNP class elements for SNP database
del
delins
ins
mnv
snv
where del is for deletion of a single nucleotide, delins is a block substitution where a series of nearby nucleotides have been replaced with a different set of nucleotides (also called a sub), ins is for insertion of a nucleotide, mnv is for multiple nucleotide variation with alleles of common length greater than one, and snv, or single nucleotide variant.
An example query to obtain numbers of single nucleotide variants (snv) for gene HIF1A
(HIF1A[Gene Name]) AND “snv”[SNP Class]
solenoid fiber
somatic cell nuclear transfer (SCNT)
somatic cell
Southern blot
spatially-restricted gene expression
speciation
Process (allopatric, sympatric, parapatric) by which new biological species come about.
species
Groups of interbreeding or potentially interbreeding populations that are evolutionarily independent of other such populations. The term species also refers to a taxonomic category. Often, but not always, the biological concept and the taxonomic concept of species are equivalent.
species tree
A phylogenetic (species) tree might be defined as the pattern of branching of species lineages via the process of speciation.
References
Maddison WP (1997) Gene trees in species trees. Syst. Biol. 46:523-536
spectral karyotype (SKY)
spliceosome
splicing
split-gene
standard genetic code
TTT F Phe TCT S Ser TAT Y Tyr TGT C Cys
TTC F Phe TCC S Ser TAC Y Tyr TGC C Cys
TTA L Leu TCA S Ser TAA * Ter TGA * Ter
TTG L Leu TCG S Ser TAG * Ter TGG W Trp
CTT L Leu CCT P Pro CAT H His CGT R Arg
CTC L Leu CCC P Pro CAC H His CGC R Arg
CTA L Leu CCA P Pro CAA Q Gln CGA R Arg
CTG L Leu CCG P Pro CAG Q Gln CGG R Arg
ATT I Ile ACT T Thr AAT N Asn AGT S Ser
ATC I Ile ACC T Thr AAC N Asn AGC S Ser
ATA I Ile ACA T Thr AAA K Lys AGA R Arg
ATG M Met ACG T Thr AAG K Lys AGG R Arg
GTT V Val GCT A Ala GAT D Asp GGT G Gly
GTC V Val GCC A Ala GAC D Asp GGC G Gly
GTA V Val GCA A Ala GAA E Glu GGA G Gly
GTG V Val GCG A Ala GAG E Glu GGG G Gly
Initiation codon: ATG
Alternative start codon(s): GTG (for a yeast ribosomal protein gene)
source: http://www.ncbi.nlm.nih.gov/Taxonomy/taxonomyhome.html/index.cgi?chapter=cgencodes
start codon
statistical genetics
stem cell
stem-loop
sticky end
stop codon
strawman argument
Any argument based on mischaracterization of the opponent’s actual position; more broadly, a misrepresentation of someone’s argument so it is easier to attack or refute (see Red Herring)
from Wikipedia
A straw man is a common form of argument and is an informal fallacy based on giving the impression of refuting an opponent’s argument, while actually refuting an argument that was not advanced by that opponent. The so-called typical “attacking a straw man” argument creates the illusion of having completely refuted or defeated an opponent’s proposition by covertly replacing it with a different proposition (i.e. “stand up a straw man”) and then to refute or defeat that false argument (“knock down a straw man”) instead of the original proposition.
stringency
structural gene
substitution
swivel point
synonymous mutation
synonymous substitution
t-test
The two sample independent t-test is a simple statistical test for testing the hypothesis of no difference between two sample means. The formula is

where X “bar” is the simple mean (average) for sample group one, X “bar” 2 is the mean for sample group two, and the term in the denominator is the “pooled standard error of the mean. The null hypothesis is that the true difference in means between the two groups is equal to zero.
Yes, you can get the t-test in Microsoft Excel, but there are real programs that do these kinds of statistical calculations much easier. For example, you should know about the statistical language R — we use it in Biostatistics. Or, if you want, there are many of online sites that provide calculators for you. For example, www.graphpad.com. Select the unpaired t-test. Here’s a worked example
Screen 1

after entering the data and clicking on “calculate now” button I get
Screen 2

And Microsoft Excel?
To calculate the t-test you could work through Microsoft Excel in two ways. If your version has the Data Analysis package installed, then you will find the t-test within the data analysis package and you would follow the instructions therein. If you do not have that package, or if you just want to use the built-in functions, then you would make two function calls. The first function is TTEST() and you enter the array for group1, the array for group 2, then “2” for “two-tailed test” (because it doesn’t matter if the difference is greater or less than zero), and finally, another “2” to instruct Excel that you are calculating a “independent two-sample t-test” (there are other kinds of t-tests!). This returns the probability or p-value; by convention, if the p-value is less than 0.05 or 5% we conclude that the two groups are statistically different. If you want the actual value of the t-test (like in the formula), then you need a second function, TINV(). Enter the probability of t-test (the result you just got from the TTEST function), and the number of degrees of freedom for the t-test, which is df = n1 + n2 – 2. For our example, then result of TTEST is 0.00105197 and the result of TINV is 8.497058314 with df = 4.
tandem repeat
TATA box
taxonomy
The biological discipline of defining and naming groups of organisms. Following Karl Linneaus, organisms are assigned to hierarchical taxonomic ranks, first to species, then to genera which are groups of species, then to families which are groups of genera. Above the level of family, the ranking of groups continues with orders, classes, phyla (divisions in plants), kingdom, and finally domains. With the advent of phylogenetics, classification of organisms attempts to reflect the evolutionary history of organisms, and not simply the overall similarity of the organisms.
telomere
telophase
template strand
termination codon
text file
Bioinformatics files generally are saved as plain text files. It is highly recommended that you use a text file editor instead of your regular word processor to work with text files. Modern word processors introduce formatting, which requires special handling by programs; most bioinformatics software lack ability to work with rtf, doc, docx, odt, or xml files. Note that while you can force word processors to save to plain text, this can mean many steps, and can be better handled by an application designed to work with plain text.
Text file editors installed on The Macbook Lab computers include the TextEdit (default) and TextWrangler applications. These applications may be accessed via the Applications folder. Additionally, vim and emacs are preinstalled (these are command line programs; vim has menu-driven version too: gwin). All Microsoft Windows computers come preinstalled with Notepad (start via your Run command at the Start menu). There are many free and more flexible text editors available for Windows pcs, including Notepad++.
theory
from Wikipedia, a scientific theory is
a well-substantiated explanation of some aspect of the natural world that is acquired through the scientific method and repeatedly tested and confirmed through observation and experimentation…. Scientific theories are testable and make falsifiable predictions.
A scientific theory is not simply a guess or proposed explanation for a phenomenon — that is what we call hypothesis.
thymine
a nucleobase, pyrimidine
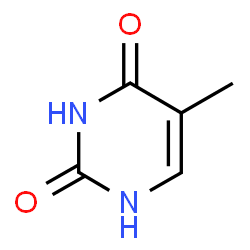
Image source: chemspider.com
thymidine
The thymine nucleobase attached to deoxyribose (DNA), with a phosphate group added at the 5′ end of the sugar. RNA version is 5′-Methyluridine
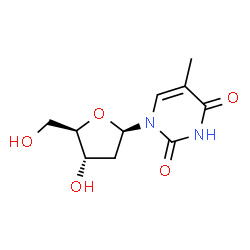
Image source: chemspider.com
tissue-specific gene expression
trait
trans
transcript of unknown function (TUF)
transcription factor (TF)
transcription
transcriptional bursting
transcriptome
transfer RNA (tRNA)
transgene
transition
Refers to a DNA point mutation, a single purine base (A or G) to another purine base or a single pyrimidine base (T or C) to a single, different pyrimidine base.
translation
translatome
translocation
transposable element
transposon
transversion
Refers to a DNA point mutation, a single purine base (A or G) is replaced by a a single pyrimidine base (T or C) or the reverse: a single pyrimidine base is replaced by a single purine base.
tree files
Trees are a way to represent connections between vertices (in phylogeny we call these OTUs or tips) by paths or edges (in phylogeny we call edges branches). Trees are a part of graph theory.
The data for creating the images of phylogenetic trees in UGENE are stored as text files in a universal format (Newick, NEXUS, Phylip) readable by many programs better suited for drawing trees.
NEXUS file extension is *.nex
NEWICK file extension is *.nwk
Phylip file extension is *.phy
In addition to UGENE, other software installed on the MacBooks you may use to view and or work with tree files include:
- Njplot
- MEGA6
- Treegraph2
- TreeView
- ape – an R package
Online sites you can use include
For more about trees, see the graph theory entry at Wikipedia.
tree reconciliation
For any given set of taxa, gene trees and phylogenies for the taxa do not necessarily agree. That is the topology may differ. A gene tree for a set of taxa is constructed from sets of amino acid (or DNA base) differences among sets of sequences. On the other hand, a phylogeny for a set of taxa is constructed from all available information, resulting in a consensus tree. Tree reconciliation is the process of comparing gene trees against a phylogeny. Differences between the two suggest accelerated (or reduced) rates of evolution for the gene (protein).
References
Swenson, K. M., Doroftei, A., & El-Mabrouk, N. (2012). Gene tree correction for reconciliation and species tree inference. Algorithms for Molecular Biology, 7(1), 31. (link)
true-breeding
UAA (“ochre”)
UAG (nicknamed “amber”)
UGA (“opal”)
unequal crossing-over
UPGMA
A clustering algorithm
upregulation
uracil
a nucleobase, pyrimidine
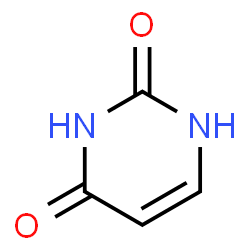
Image source: chemspider.com
uridine
The thymine nucleobase attached to ribose (RNA), or deoxyribose (DNA), with a phosphate group added at the 5′ end of the sugar.
variance
A statistical concept; the spread of values or dispersion from the statistical mean for a collection of observations, x. The equation for the variance is

where s2 refers to the sample variance, the X with the “bar” over it is referred to as “X-bar” and symbolizes the mean of the sample, ∑ is sigma and denotes summation operation, n is the sample size, and i refers to each individual observation. The square root of the sample variance is called the sample standard deviation, symbolized as s.
Virus
vitalism
Vitalism is the position that life is more than the material and that it cannot be explained by reductionism or holism, but rather is governed by ultimately unknowable laws or forces.
see Reductionism
weasel words
Weasel words are common the scientific literature.
Weasel words or statements are deliberately vague or misleading. Wikipedia has a good description and includes examples.
(Note that my claim that “Weasel words are common…” is a weasel — no evidence is provided to justify the claim.)
Western blotting
wild type (WT)
X chromosome
X-inactivation
from Wikipedia: Also called lyonization (Mary Lyon), a process by which one of the copies of the X chromosome is inactivated in female mammals. The transcriptionally inactive X chromosome is silenced by heterochromatin. X-inactivation prevents females from having twice as many X chromosome gene products as males (see dosage compensation). The inactivated chromosome is visible under the microscope as a densely staining object, or Barr body.
X-linked trait
xenolog
Two homologous (homology) genes (DNA elements) are xenologous if they are derived from a horizontal gene transfer event.
References
Koonin EV (2005) Orthologs, Paralogs, and Evolutionary Genomics. Annu. Rev. Genet. 39:309–338